S-Pulse: SAP system health monitoring & operational visibility
Monitor system health, track performance trends, detect issues early, and improve operational decision-making through centralized SAP monitoring dashboards.
Monitor system health, track performance trends, detect issues early, and improve operational decision-making through centralized SAP monitoring dashboards.
S-Pulse is a monitoring application designed to provide a centralized view of SAP system health, technical performance, and operational risk. It helps teams move away from fragmented manual monitoring by bringing together critical health indicators, historical trends, alerts, and dashboard-driven visibility in one place.

Track critical SAP system parameters without relying on manual collection.

See a centralized snapshot of overall system health, stability, and technical issues before they create business impact.

Analyze system performance across time using date-based filters, last-7-days views, and period-over-period comparisons for metrics like memory, workload, and system behavior.
Set configurable thresholds for monitored parameters so teams can identify issues proactively and reduce the risk of downtime.
Give technical and management teams a high-level summary of KPIs, issues, and monitoring indicators that support faster troubleshooting and clearer decisions.
Bring multiple technical views into one monitoring experience so teams can assess current status, recent trends, and emerging issues more easily.

SAP operations teams often rely on fragmented checks, manual reporting, and delayed issue visibility. S-Pulse is designed to reduce that effort by creating a centralized monitoring view that supports proactive operations, faster incident resolution, stronger performance analysis, and better operational transparency.

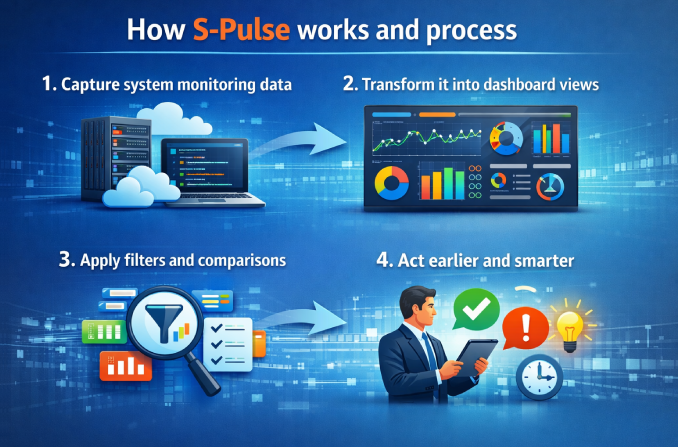
Technical monitoring data is collected and organized for centralized review.
Monitoring data is visualized through dashboard-style views and summaries.
Users can review current, historical, and comparison views using dates and ranges.
Teams use the insights to improve performance, respond faster, and strengthen operational decision-making.
Track technical parameters, logs, dumps, jobs, and system behavior more efficiently.
Get a high-level view of system health, risk, and performance without relying only on manual reports.
Use health views and trends to identify issues faster and reduce troubleshooting time.
Monitor overall operational stability through a cleaner summary view.
S-Pulse is a multi-layer SAP monitoring solution that gives organizations visibility into system health across infrastructure, application operations, and business-facing performance indicators.
S-Pulse supports monitoring at three levels:
This helps both technical teams and leadership understand system health from different perspectives.
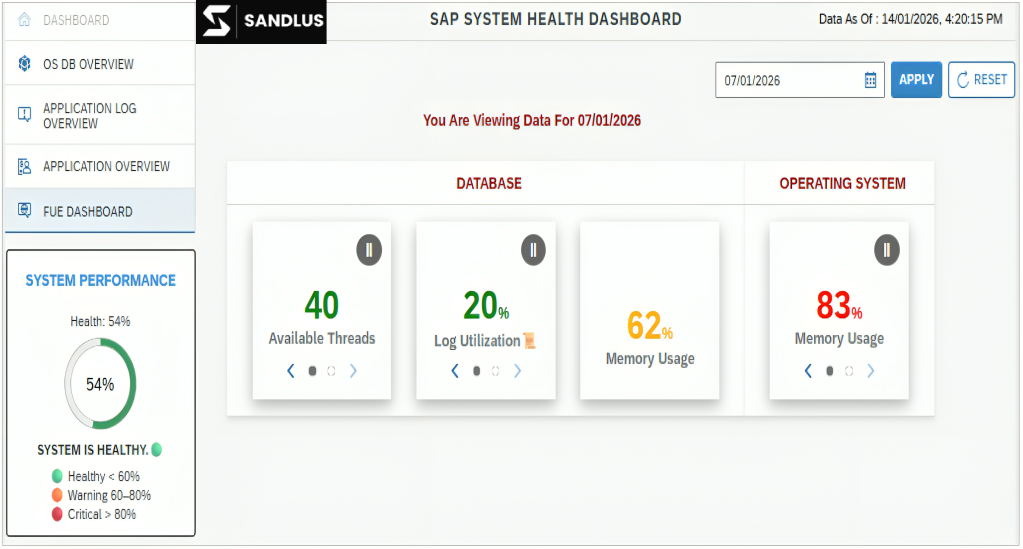
At the infrastructure level, S-Pulse can monitor areas such as operating system and database health, along with performance indicators like CPU, memory, workload, and resource-consumption trends.
At the application level, S-Pulse can monitor technical and SAP operational areas such as system logs, dumps, work processes, jobs, background activities, and system output, helping teams identify technical issues before they affect users.
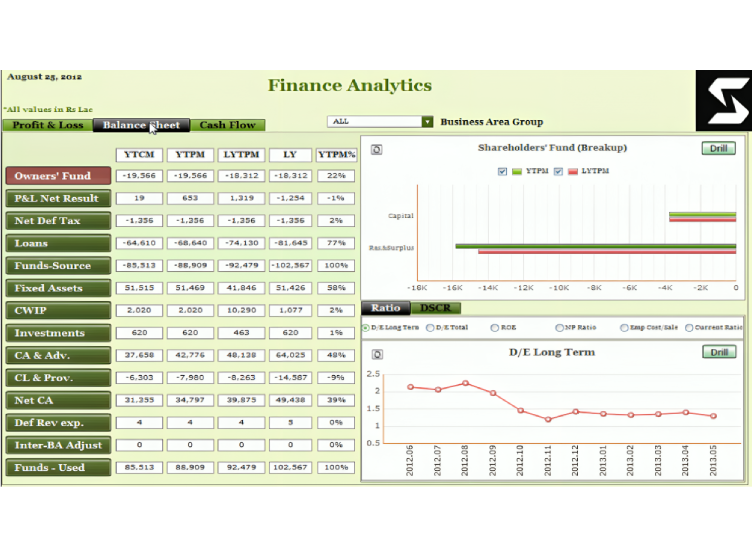
At the business level, S-Pulse provides management-oriented summaries and KPI views that highlight system status, operational impact, and critical issues requiring attention. This helps leadership understand system health without relying only on detailed technical reports.
Enthusiastically disintermediate one-to-one leadership via business e-commerce. Dramatically reintermediate compelling process improvements rather than empowered relationships.